- Catalogues
- Envira
- Catalogue Nanoenvi EQ
Catalogue Nanoenvi EQ
1 /20Pages

Catalogue Nanoenvi EQ
1 /20Pages
Extraits du catalogue

Portable Ambient Air Quality Monitoring Station
Ouvrir le catalogue en page 1
pnviraTable of contents Nanoenvi EQ & Envira Parameters monitored Connectivity and power supply Data exploitation and integration
Ouvrir le catalogue en page 2
Air Pollutants + Weather + Noise 1 Single Device 24/7. Wherever. In real time.
Ouvrir le catalogue en page 3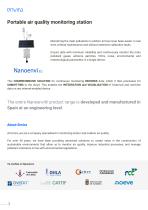
Portable air quality monitoring station Monitoring the main pollutants in outdoor air has never been easier: in real time, without maintenance and without extensive calibration tasks. Ensure data with minimum reliability and continuously monitor the main pollutant gases, airborne particles, VOCs, noise, environmental and meteorological parameters in a single device. This COMPREHENSIVE SOLUTION for continuous monitoring RECORDS data, which it then processes for SUBMITTING to the cloud. This enables the INTEGRATION and VISUALISATION of historical and real-time data on any internet-enabled device....
Ouvrir le catalogue en page 4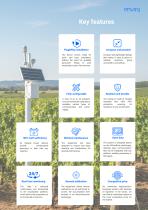
Key featuresPlug&Play installationCompact and portable The device comes ready for quick and easy installation, without the need for qualified personnel. Ready to start measuring in just a few minutes. Compact and lightweight design that makes it easy to place in multiple locations, going unnoticed in any setting. Fully configurable A total of up to 23 pollutant and environmental parameters available, various types of communication and power supply. The casing is made of durable materials that offer IP65 protection, ensuring its resistance in any environment. Minimal maintenance Open data Its...
Ouvrir le catalogue en page 5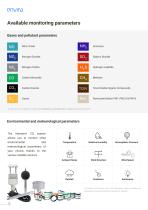
Available monitoring parameters Gases and pollutant parameters Nitric Oxide Nitrogen Dioxide Sulphur Dioxide Nitrogen Oxides Hydrogen sulphide Carbon Monoxide Carbon Dioxide Total Volatile Organic Compounds The Nanoenvi EQ configuration enables the simultaneous monitoring of up to 11 gases and particulate matter. Environmental and meteorological parameters The allows you to monitor other environmental Relative Humidity Atmospheric Pressure meteorological parameters of your choice, thanks to the various satellite sensors. Ambient Noise Wind Direction Wind Speed All Nanoenvi EQ devices come with...
Ouvrir le catalogue en page 6
Connectivity and power supply Nanoenvi® EQ monitoring stations are integrated into IoT networks through standard M2M protocols (4G/LTE, Ethernet, WiFi, and LoRaWAN). This allows for adaptable integration into different connectivity scenarios, making them Plug and Play devices. Power supply systems The Nanoenvi® EQ device has different power supply options, including battery and non-battery options, to provide electrical autonomy regardless of where it is installed: NO battery options Battery options Mains power Mains power + battery Power Over Ethernet Solar panel + battery
Ouvrir le catalogue en page 7
#CloudFree Design Philosophy At Envira, we do not believe in captive customers. That’s why the Nanoenvi EQ system is designed to offer open communication that can be integrated via MQTT with any platform, without relying on proprietary software or paid subscriptions. 7
Ouvrir le catalogue en page 8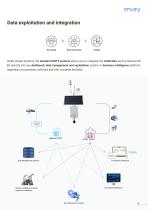
Data exploitation and integration Data submission Unlike closed systems, the standard MQTT protocol allows you to integrate the JSON data sent by Nanoenvi® EQ directly into any dashboard, data management and exploitation system or business intelligence platform, regardless of proprietary software and with complete flexibility. Concentrator / Gateway Proprietary Dashboard Data Management Systems Third-party Dashboards SCADA and BMS automation systems via Gateway Data exploitation systems
Ouvrir le catalogue en page 9
Propietary Dashboard At Envira, we have designed our own easy-to-use multi-user data visualisation platform: all you need is a device with internet access to view the monitored parameter data anytime, anywhere. This data is collected minute by minute on a continuous basis and transmitted to the platform so that both parameters can be monitored in real time and historical data can be reviewed. The Nanoenvi EQ system's proprietary platform also allows for the generation and export of reports and notification via customised alarms by e-mail when the concentration of a pollutant exceeds the pre-set...
Ouvrir le catalogue en page 10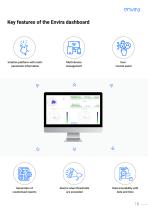
Key features of the Envira dashboard Intuitive platform with multi-parameter information control panel Generation of customised reports Alarms when thresholds are exceeded Data traceability with date and time
Ouvrir le catalogue en page 11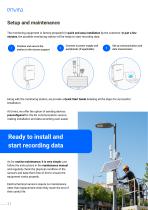
Setup and maintenance The monitoring equipment is factory-prepared for quick and easy installation by the customer. In just a few minutes, the portable monitoring station will be ready to start recording data. Position and secure the station to the chosen support Connect to power supply and peripherals (if applicable) Set up communication and data transmission Along with the monitoring station, we provide a Quick Start Guide detailing all the steps for successful installation. At Envira, we offer the option of sending devices preconfigured for the 4G communication version, making installation...
Ouvrir le catalogue en page 12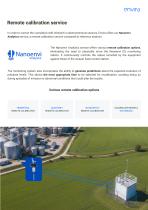
Remote calibration service In order to correct the cumulative drift inherent in electrochemical sensors, Envira offers our Nanoenvi Analytics service, a remote calibration service compared to reference stations. The Nanoenvi Analytics service offers various remote calibration options, eliminating the need to physically move the Nanoenvi EQ monitoring station. It continuously controls the values recorded by the equipment against those of the closest fixed control station. The monitoring system also incorporates the ability to generate predictions about the expected evolution of pollutant levels....
Ouvrir le catalogue en page 13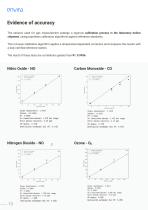
The sensors used for gas measurement undergo a rigorous calibration process in the laboratory before shipment, using proprietary calibration algorithms against reference standards. This in-house calibration algorithm applies a temperature-dependent correction and compares the results with a duly certified reference station. The result of these tests are correlations greater than R2: 0.9996. Carbon Monoxide - CO Slope (pendiente): 1.0417 Offset: -19.8283 R3: 0.9999 No linealidad mâxima: 1.07% del rango Error mâximo absoluto: 3.25 ppb CV medio: 0.27% No linealidad mâxima: 1.36% del rango Error...
Ouvrir le catalogue en page 14Tous les catalogues et fiches techniques (PDF) Envira
 Nanoenvi IAQ Fitness centers
8 Pages
 Fiche technique IAQ
19 Pages
 Catalogue IAQ
4 Pages
 NANOENVI eqPM
2 Pages
 UrVAMM
2 Pages

- Logiciel d'automatisation
- Solution logicielle de gestion
- Logiciel de process
- Logiciel temps réel
- Solution logicielle cloud
- Logiciel de commande
- Logiciel de supervision industriel
- Solution logicielle industrielle
- Logiciel de qualité
- Solution logicielle de simulation
- Logiciel automatisé
- Module de surveillance en temps réel
- Module de surveillance de mesure
- Module de surveillance de température
- Système de surveillance de l'environnement
- Module de surveillance en continu
- Logiciel haute performance
- Module de surveillance numérique
- Système de surveillance de production
- Logiciel de stockage